PROJECTS
- BOOTSTRAP
- JAVASCRIPT
- PYTHON
- CSS
- HTML
- UNC
- FRAMER
- WORDPRESS
- WEBFLOW
- JSON
- JQUERY


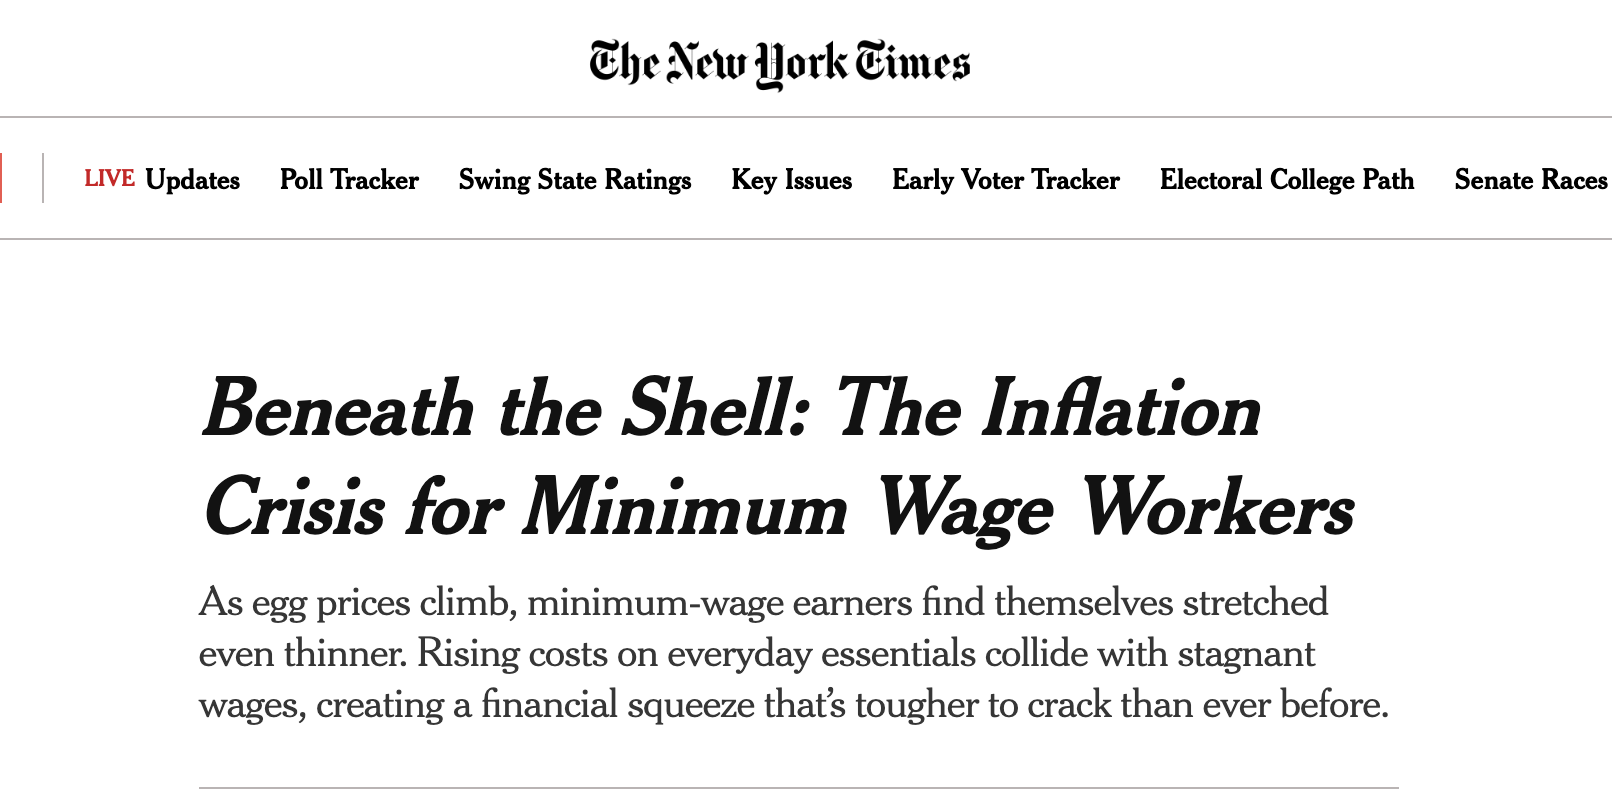
NYT - Data Dashboard
- CSS
- HTML
- Json
Created a data-driven dashboard in the style of The New York Times for an article examining the impact of inflation on minimum-wage workers. Using data from sources like data.gov, I designed an interactive web application with responsive visualizations that told a compelling story about the erosion of purchasing power over time. The project featured interactive charts, comprehensive data tables, and UI elements styled after major publishers, providing a professional and polished presentation aligned with the standards of high-profile media platforms. (Used Chart.js for the graphs)

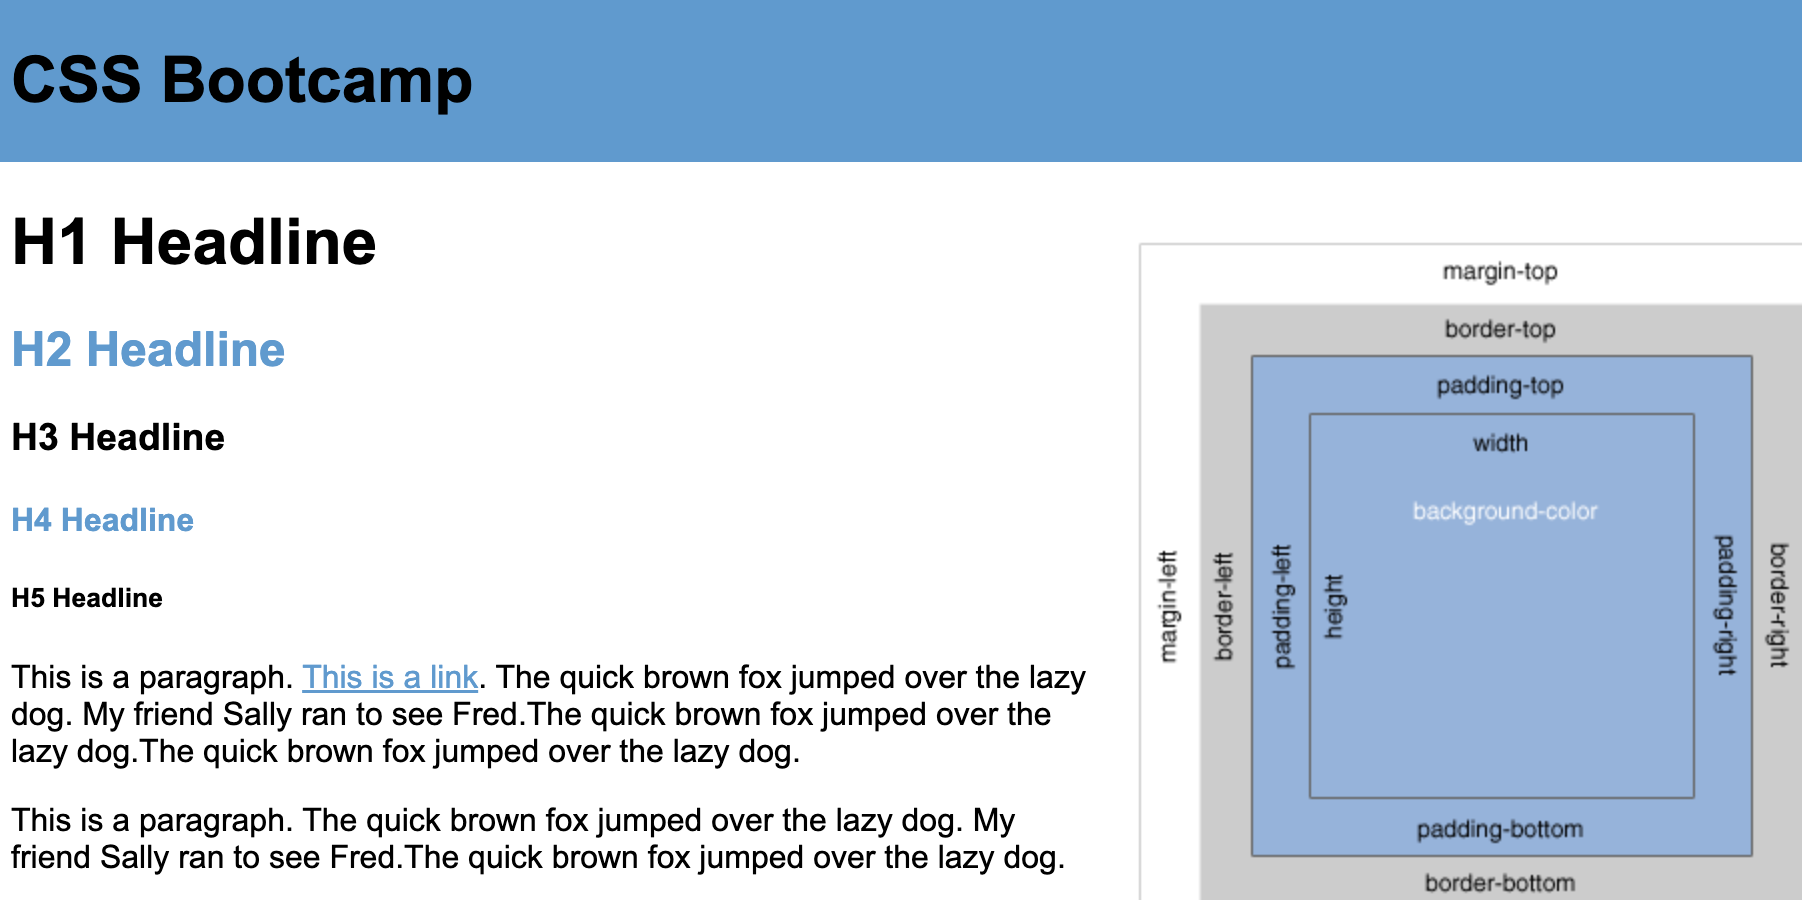
MEJO: CSS-Extreme
- CSS
- HTML
Converted a full-color design into a static HTML/CSS page, ensuring pixel-perfect replication. The page was responsive and included interactive hover effects, functional links, and form elements. Used real text for content, with images for graphs, and ensured compliance with client design specifications.

MEJO: Info-Slider
- JQUERY
- CSS
- HTML
Created an interactive graphic for high school students that explained a concept through multimedia slides, ending with a quiz to test comprehension. Integrated multiple JavaScript plugins (slider, quiz, and custom functionality) with a focus on design, interactivity, and user experience. *Responsive on Iphone 14 Pro Max*

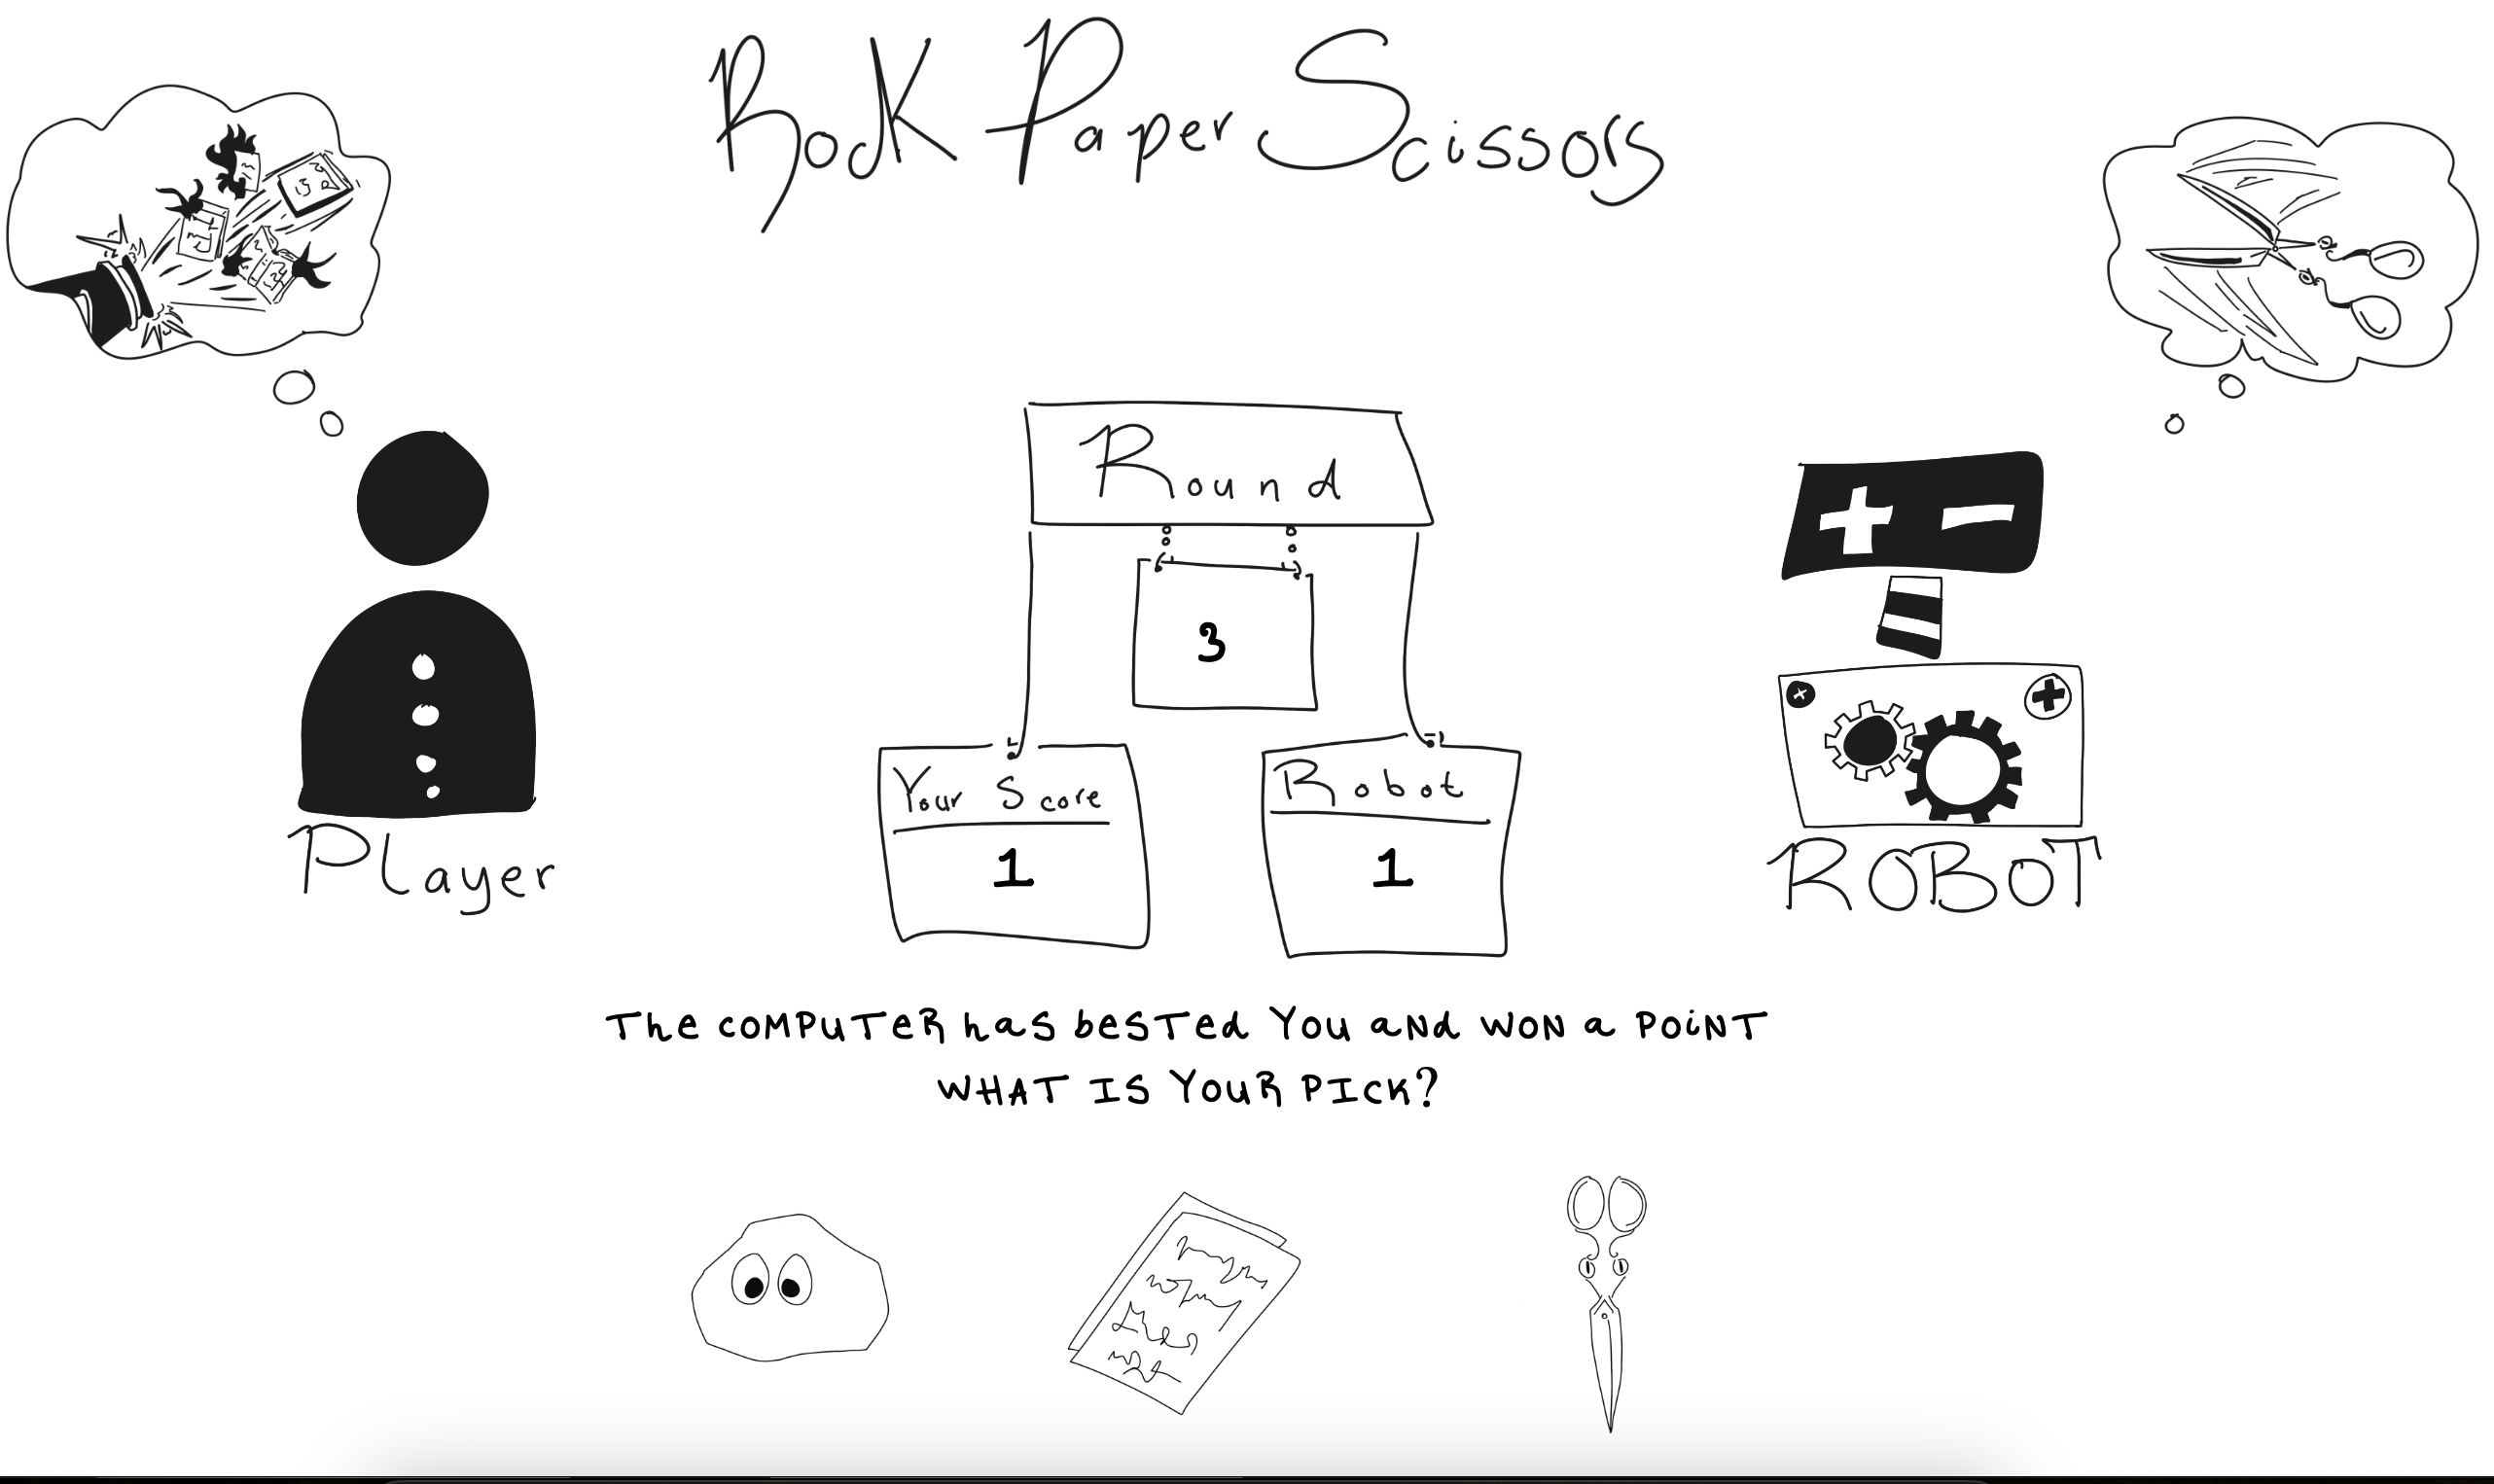
The Daily Hang
- CSS
- HTML
- JAVASCRIPT
Developing an interactive web-based game called "The Daily Hang." Integrated dynamic content, user input, and interactive gameplay elements using JavaScript and HTML/CSS. Focused on enhancing user engagement through smooth functionality and a visually appealing interface. *Responsive on Desktop*

MEJO 581: User Research
- CSS
- HTML
Conducted user research to identify pain points in a user experience within the recent graduating class job search/market. Creating a report detailing findings and recommendations for improving the site's usability and accessibility. Implemented design changes based on research insights, focusing on enhancing user engagement and satisfaction.


